Facility remote management
About facility remote management
In general, the remote monitoring of a facility refers to the management and control of one or more installations from a centralized location. In most cases, this includes the local deployment of a surveillance system that collects data from sensors and a software where the data is sent and analyzed.
In particular, the required solution to remotely manage a facility must have the capacity to grow in number of facilities being monitored in an agile and effective way. It also includes centralized control panels and dashboards with the information of all the facilities being controlled.
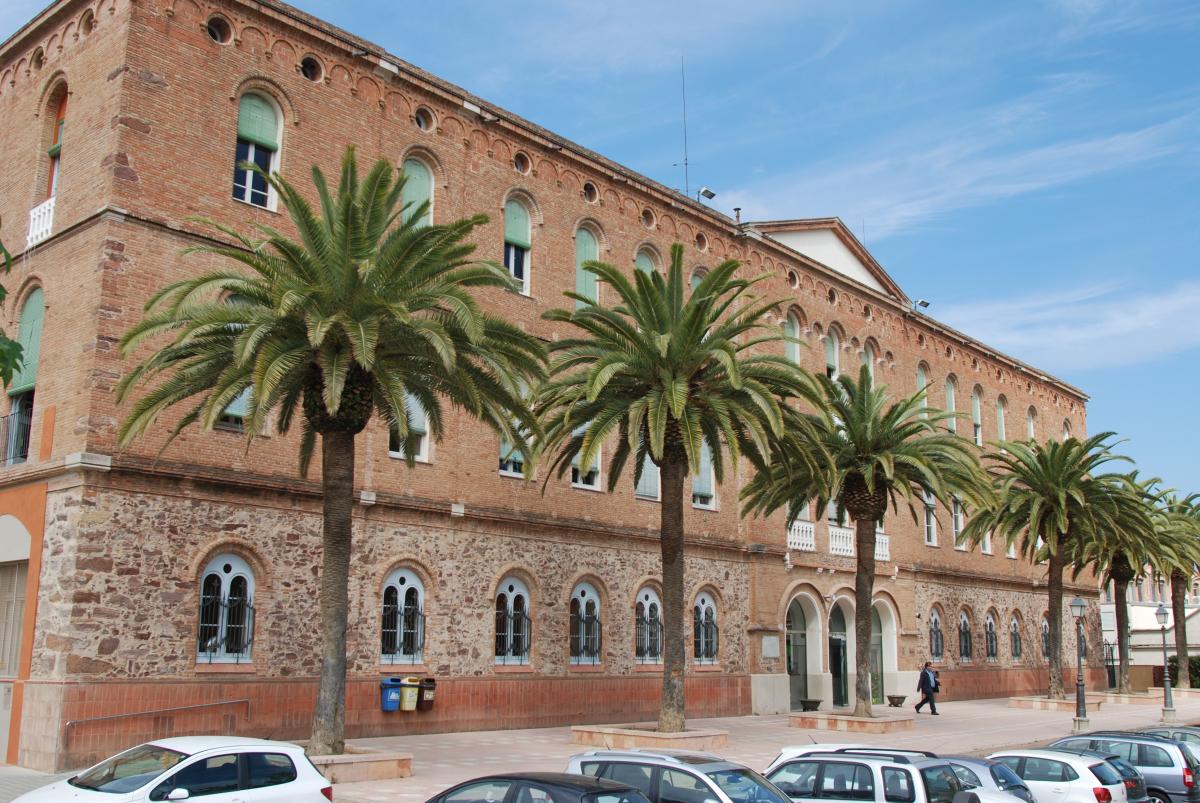
In this case study we will explain and analyze the project of the emblematic Escola Pia de Terrassa deployed by our partner BIO-DAT.
Strategy and goals
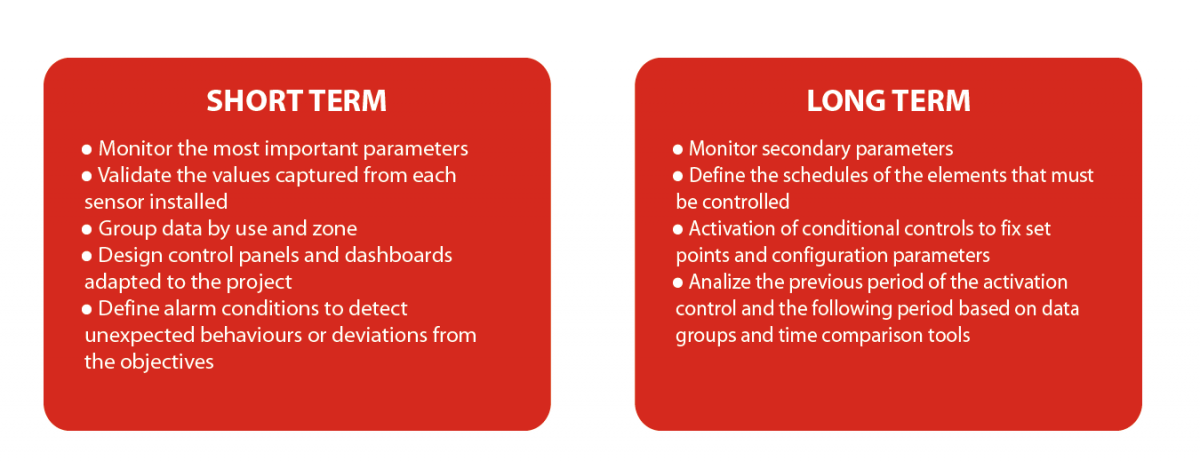
An optimal management of an installation requires a strategy split into, at least, two phases: short-term and long-term.
The first one, in time and importance, is the monitoring, which is based on the installation of devices to capture the right data depending on the project needs. Eletric consumption meters, pulse water counter, manufacturing processes controllers, temperature and humidity sensors, and analogue probes are included at this phase of the project. The goals of our project will establish the type and quantity of monitoring devices that must be installed, which is the main reason to develop a previous study to fix the objectives of the global management.
The second phase is the control, which could only be accurately executed after a period of monitoring and analysis of the collected data. The strategy of applying the same control rules in all the installations does not usually tend to deliver good results. Which is even worse, if we compare it with studying each case to apply the best scheduled and conditional actuations.
Being considered this scenary, all studies must have goals and objectives fixed. We divide them in two blocks:
Solution
Once the objectives are fixed, it's time to take action, and it includes choosing the devices and the communications appropiate for each project.
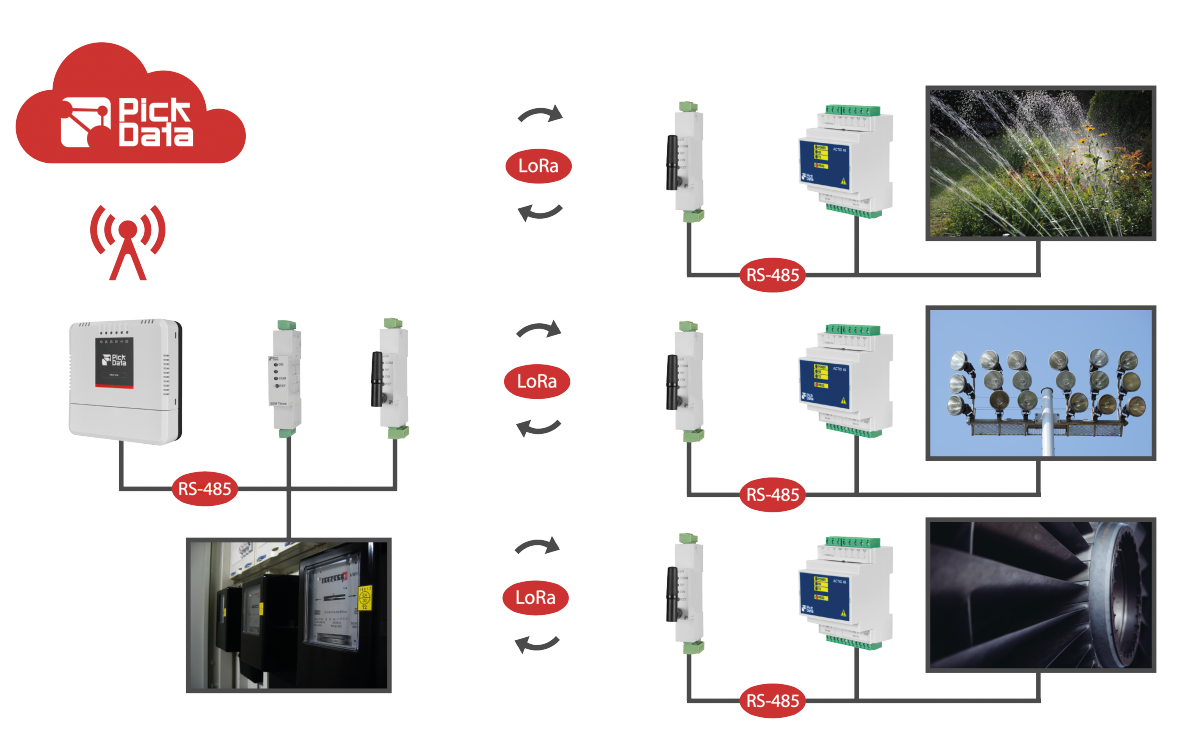
To deploy the project of Escola Pia de Terrassa we must consider that we are in front of a big terrain with several drops and levels, and the difficulty and cost of installing cable among all the facility. Under these premises, the right solution was defined on the following schema:
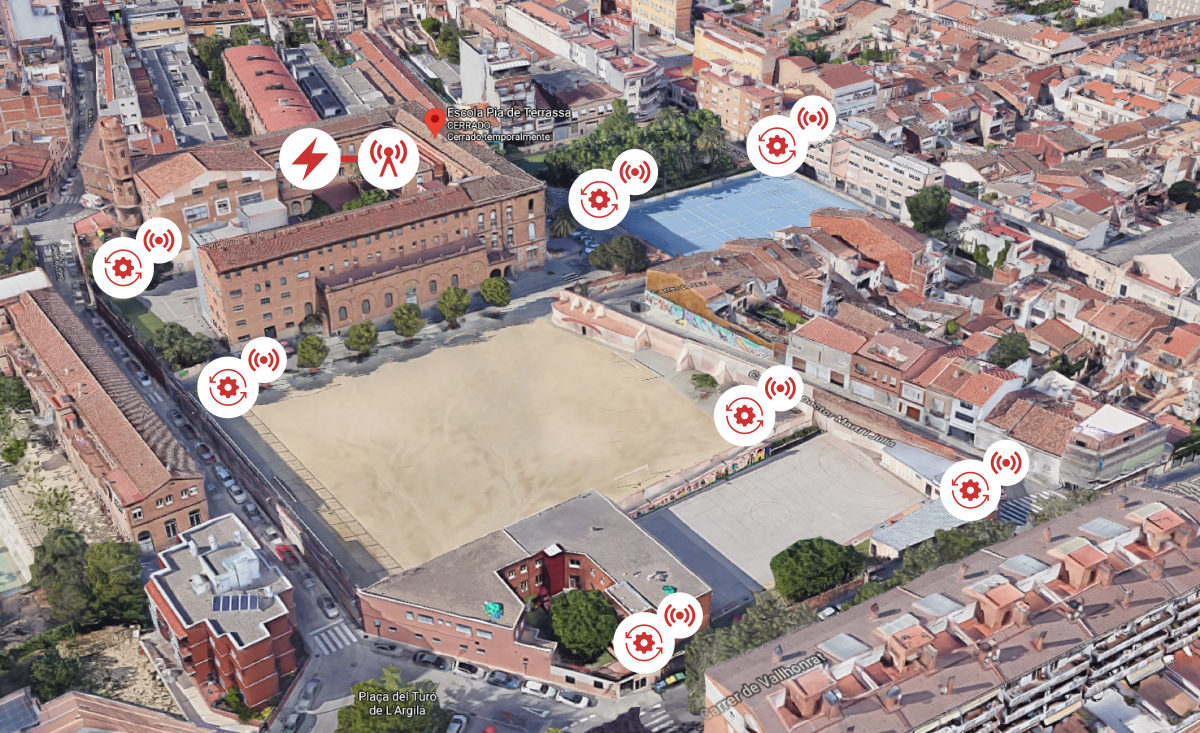
The installation of wired devices it is mandatory if we want to have fast access to monitor instant parameters through industrial communications like Modbus RTU and Modbus TCP. We decided to install Pick VPN as manager of the facility and SEM Three to monitor the electrical consumptions on this project.
However, for controlling non critical elements, we are able to use long range wireless communications like LoRa. These communications will provide us the capacity to send actions through a wireless network that will reach 15 kilometers of coverage in outdoors and 1 kilometer in indoors. In order to use only one commmunication protocol, we installed Bridge LR to convert RS-485 Modbus to LoRa, and ACTIO 40 to actuate on the irrigation, the lighting and the ventilation of the school.
Below we can take a look at the monitoring and remote control diagram for this project. We display how we combine, in the same network, wired and wireless devices as well as sensors for monitoring and control:
Results
Finally, on a project results is where we review the real impact of DataBox as monitoring and control system of this facility.
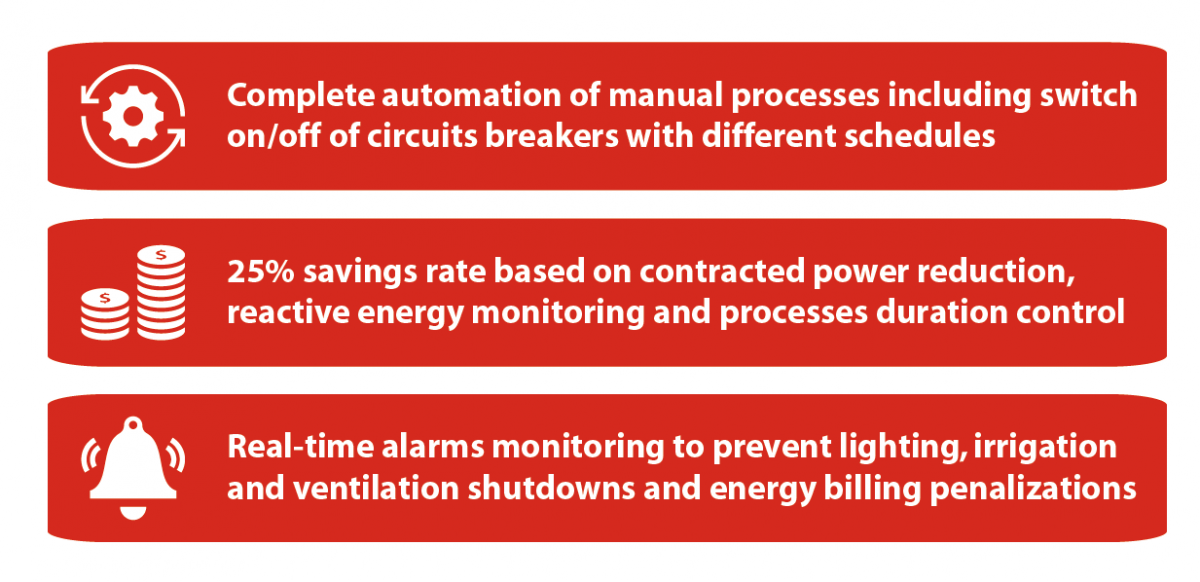
Referring to control, improvements were instantly noticed because of evolving from a manual system to a 100% automated system. Which was even better with the management of the duration of each process in order to avoid any possibility of humans errors.
In the same vein we find the alarms management and prevention, after the activation of a surveillance system of all the critical circuits to avoid faults, breakdowns and penalizations of power and reactive energy.
In addition to the results previously mentioned, we find the global savings. The electrical consumption monitoring allowed us to detect a contracted power above the needs of the school and to suggest an optimal power.
Here below, the results summary chart:
If you want to know more case studies of DataBox pay attention to the website's new features and its news section.
