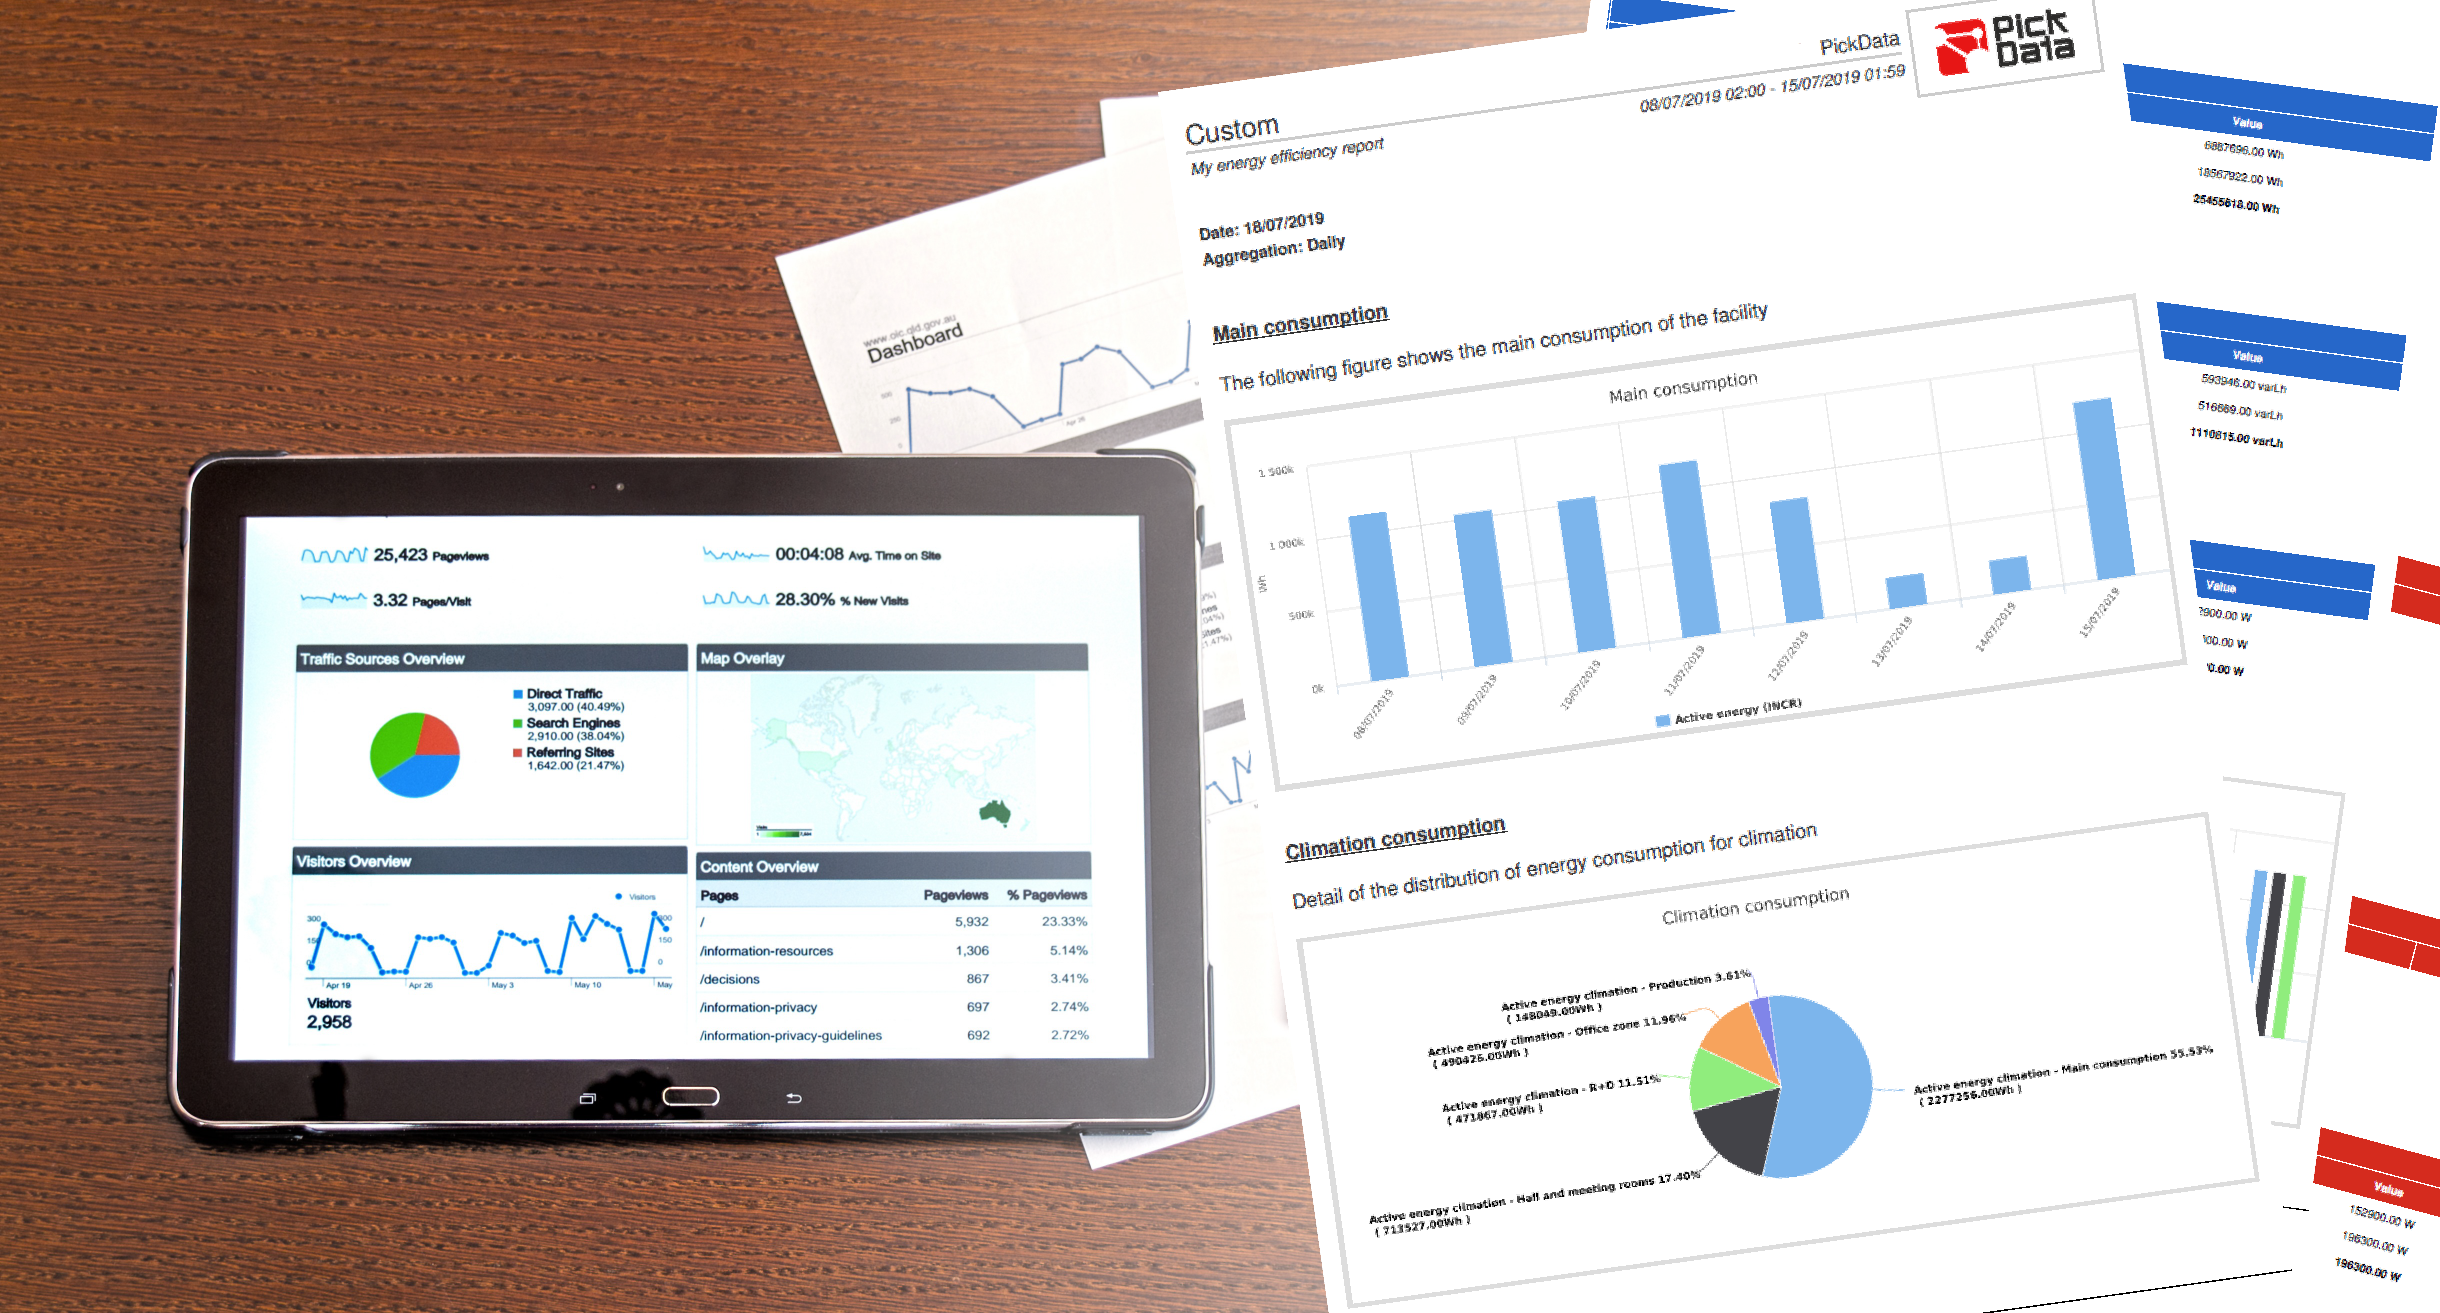
We know that predefined reports do not always meet your needs for every project. We have carefully listened to you, and due to that we present today a 100% customized report with texts, charts, statistics and much more.
The new Custom report will allow you to insert content in different ways, including graphs and tables, and data coming from devices, calculations or files import. We describe the main features below:
- Basic columns chart: A columns chart with selected parameters
- Stacked bars chart: A columns chart stacking parameters by measure unit
- Pie chart: Pie chart with selected parameters
- Table: A generic table to show data from the selected period.
- Sum: In table format, a sum of values from each selected parameter. In addition it will show a global sum grouped by measure unit
- Average, Maximum and Minimum: Identical performance than Sum but calculating averages, maximums and minimums for each parameter and grouped by measure unit
Each section of the report will have their own Title and Description, a useful tool to add comments to offer an added value to the data displayed on charts and tables. Remember that you would be able to choose the color of the report to perfectly match your corporate look&feel!
If you would like to know more about EVO IoT Platform you should visit our EVO Features section, or if you prefer it, you could contact our commercial department to receive personalized attention and a product quotation.
Documentation and other information
You can continue reading our publications in the News section .
Also, don’t forget to follow our daily journey on PickData’s official Twitter , Linkedin and other social networks.
