It is well know that the more facilities you have to handle, the less time you have to manage each one. In addition, when you exceed a number of establishments, hotels or restaurants, you are no longer able to separately analyze each facility. Nowadays it is as much important to capture your installations’ data as knowing how to manage it in an efficient way. This process is based on filtering this data to perform a fast and effective analysis.
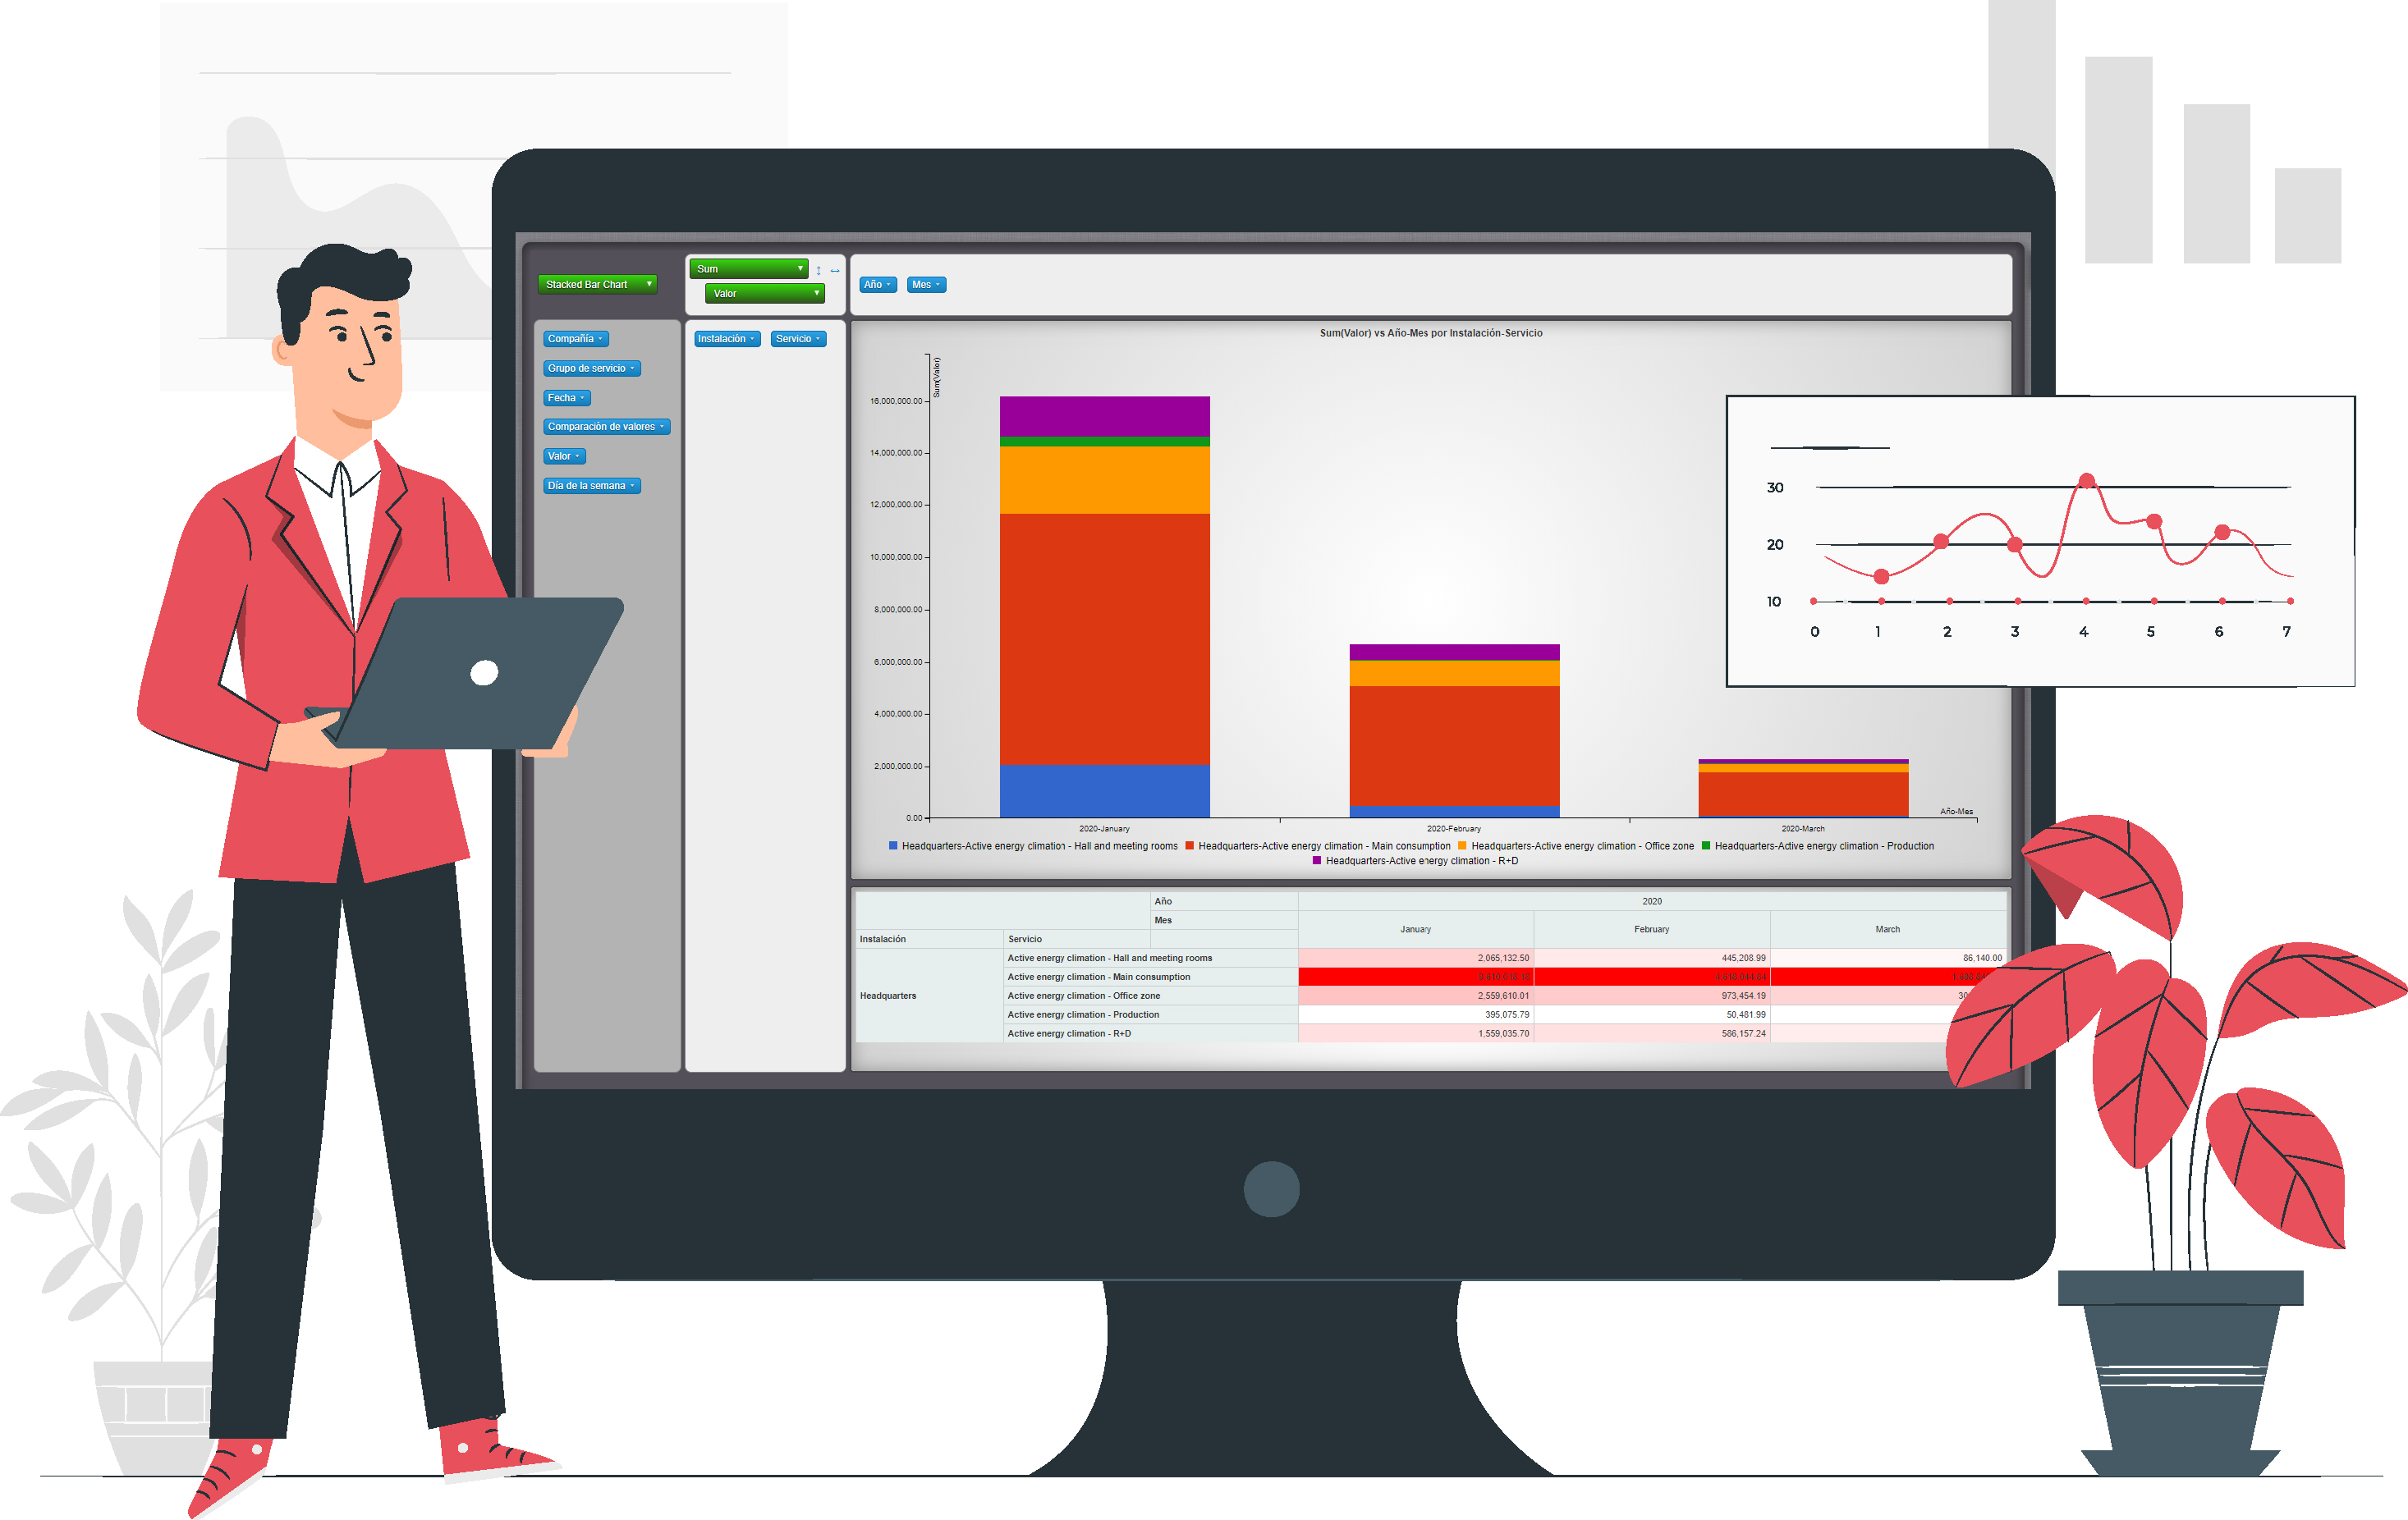
PickData EVO, as a cloud platform specialized on the management of multisite projects, launches a new comparative analysis tool based on grouping of variables and their application of temporal and quantitative filters.
First of all, the grouping of data starts with the definition of an entity to make groups. You can assign parameters captured from devices, imported data and KPI/formulae to these groups. Some examples:
- Zones: Warehouse, studio, office zone, manufacturing, laboratory, ground floor, first floor, second floor, …
- Uses: Air conditioning, lighting, power, heating, ventilation, …
- Type of parameter: Energy consumption, reactive energy penalization, maximum demand, maximum temperature, …
- Ratios and KPIs: Energy consumption per unit manufactured, consumption per square meter, custom efficiency ratio of your facility,…
Secondly, and most important, applying the convenient filters to the analysis to only show you the information that provides an added value. The time filters will allow you to select a period of data and compare it with another one; while the quantitative filters will grant you to only display the range of values that we want to analyze. Some use cases where quantitative filters can be applied to different data groups:
- Among all the data of my facilities, show only values from the group Reactive energy penalization lower than 0.95
- Among all the data of my facilities, exclude all the values of Maximum demand lower than 10 kW
- Among all the data of my facilities, show only values of facilities with a Custom efficiency ratio greater than 75%
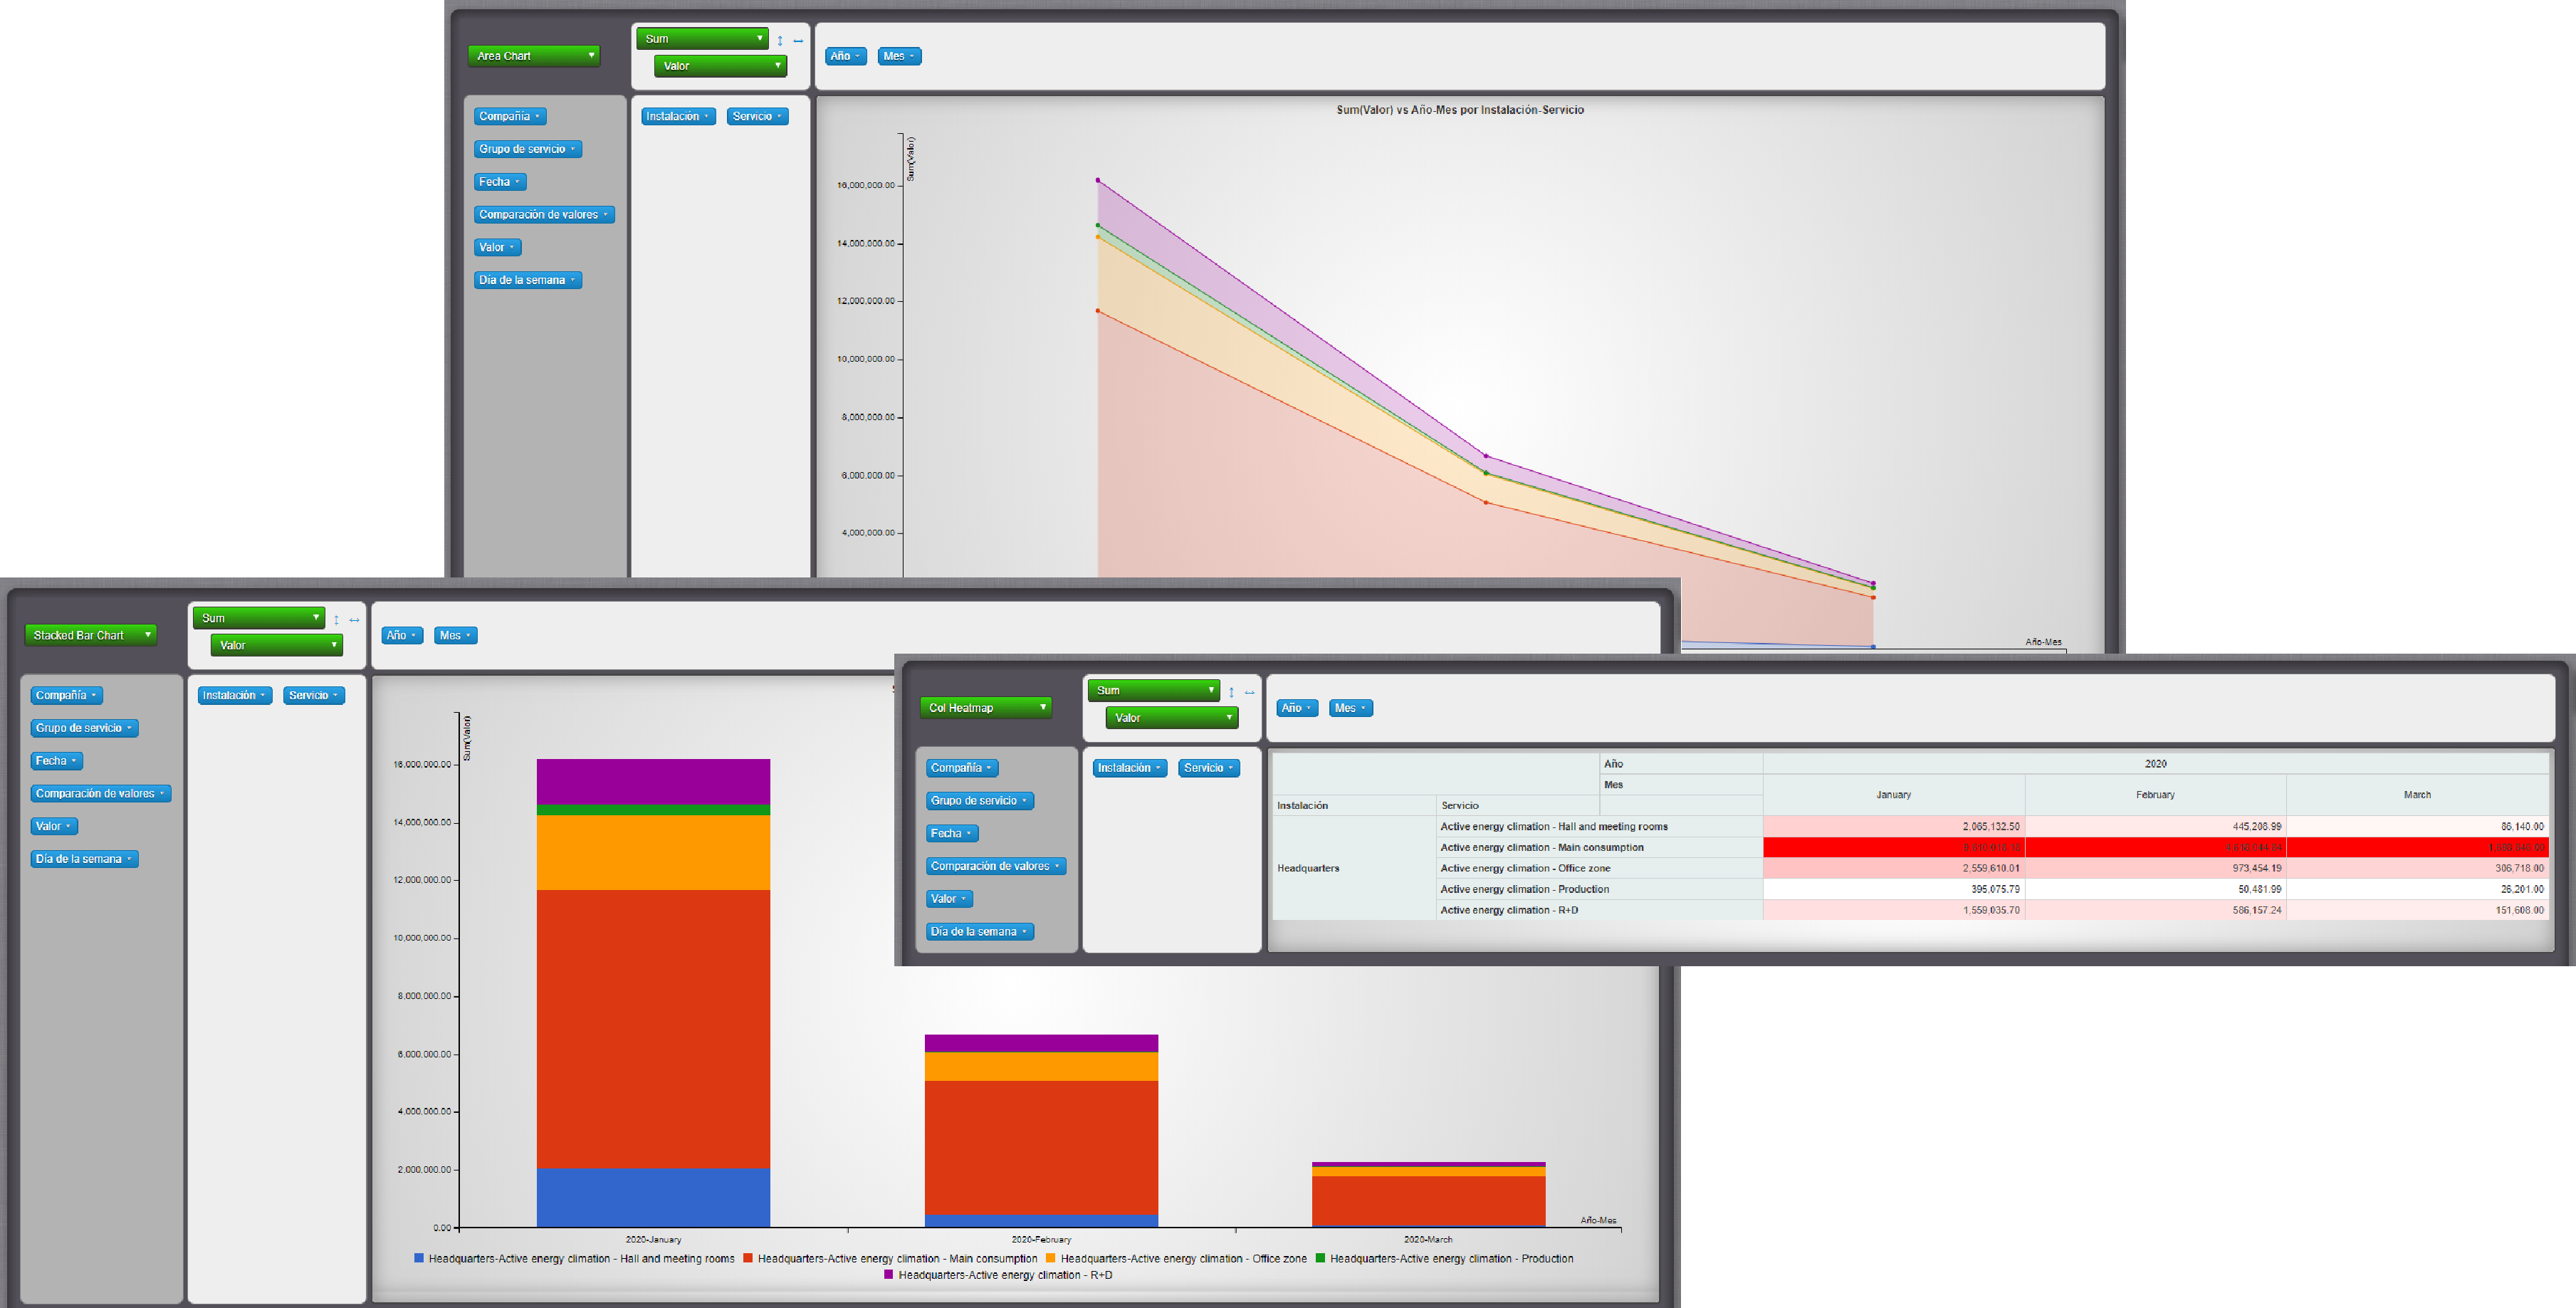
Finally, the result of the analysis is displayed on a single screen with a comparison of all your facilities in a comfortable, intuitive and efficient way. You will be able to get your results on different formats: table, heatmap and several graph types. In addition, you will be able to export your analysis to an Excel file whenever you want.
If you want to know more about EVO IoT Platform you can click here, or if you prefer it, you could contact our commercial department to receive personalized attention and a product quotation.
You can continue reading our publications in the News section .
Also, don’t forget to follow our daily journey on PickData’s official Twitter , Linkedin and other social networks.
